cPanel provides a bandwidth usage overview that displays how much bandwidth is being used by your website. It is not a real-time view of bandwidth use. The statistics are gathered from server logs and processed periodically.
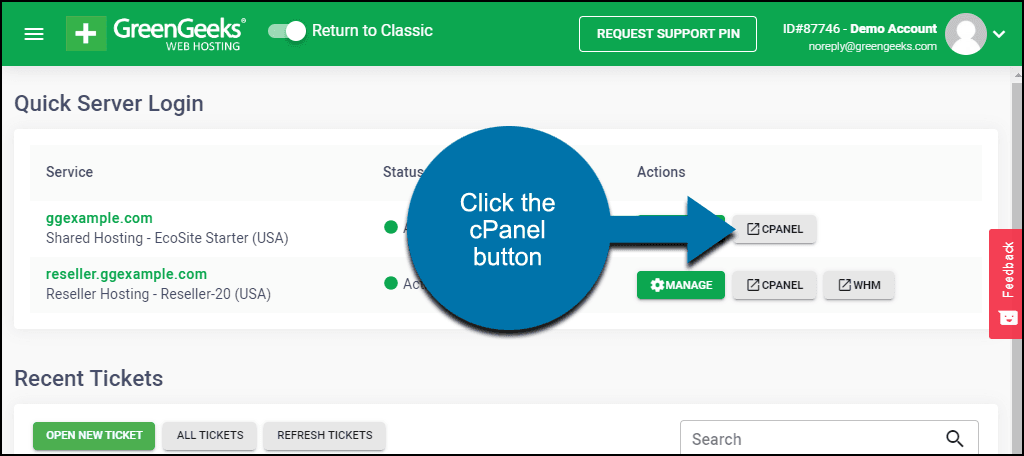
To view your website bandwidth usage stats, log in to GreenGeeks and click the cPanel button.
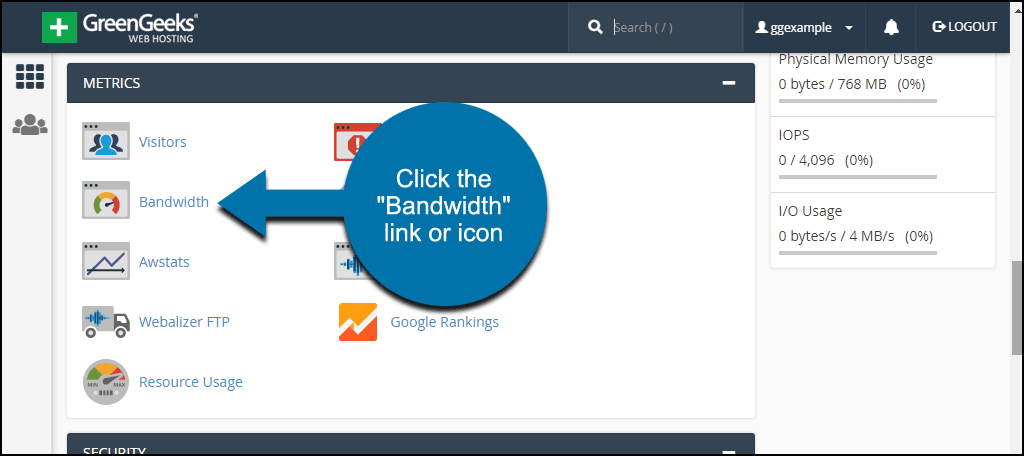
In the “Metrics” section, click the “Bandwidth” link or icon.
The first thing you’ll see are three graphs, “Past 24 hours,” “Past week,” and “Past year.”
The graphs are good for spotting trends like spikes in traffic at specific times of the day, or changes over the course of weeks.
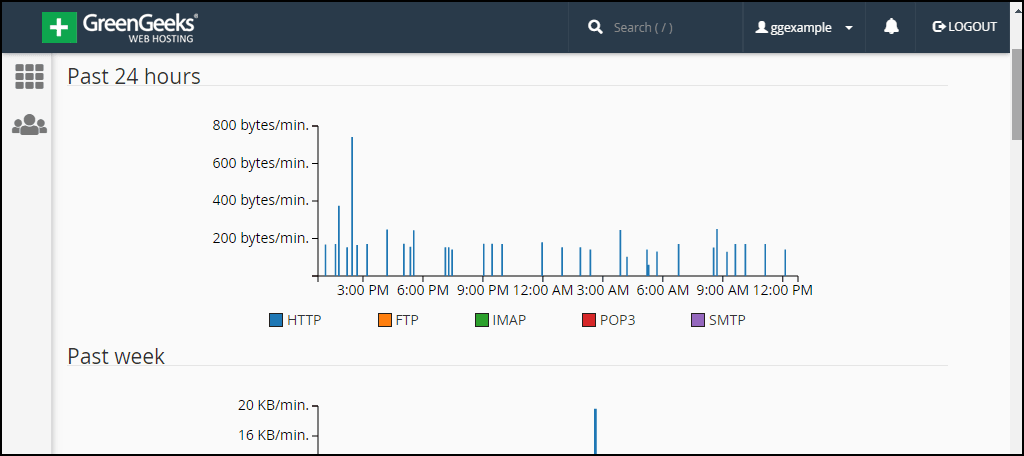
Each graph shows five data points, HTTP, FTP, IMAP, POP3, and SMTP.
HTTP is web traffic, meaning requests for pages or resources (images, etc.) on your website. The HTTP numbers are totals for domains and subdomains combined. You can see separate numbers for subdomains in the monthly statistics (below).
IMAP, POP3, and SMTP are email bandwidth use statistics, and FTP traffic reflects the bandwidth used for file transfers via FTP.
When viewing weekly and monthly data, it’s best to wait 24-48 hours after the last day of the period, so you can be sure the system has gathered and processed all of the traffic data.
Monthly Statistics Details
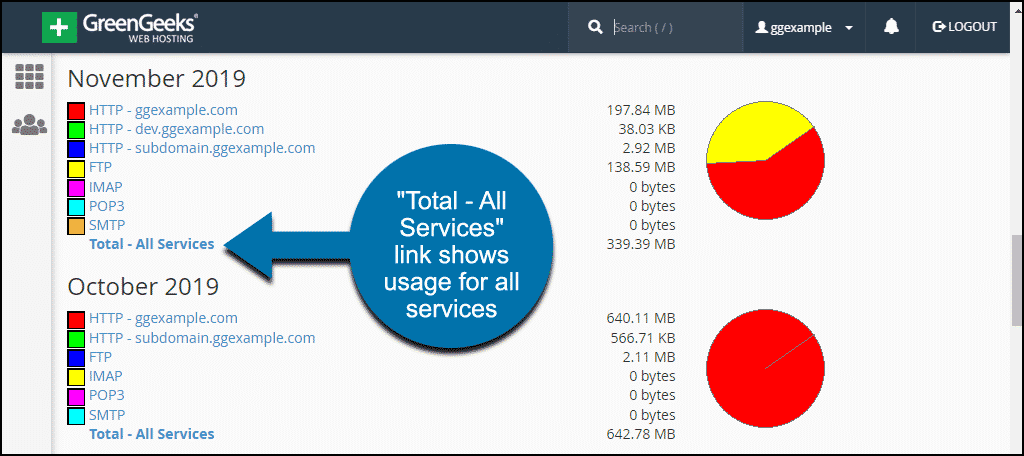
When you scroll down past the line graphs, you’ll see monthly usage breakdowns and pie charts.

Here the HTTP bandwidth usage is broken down to your primary domain and subdomains.
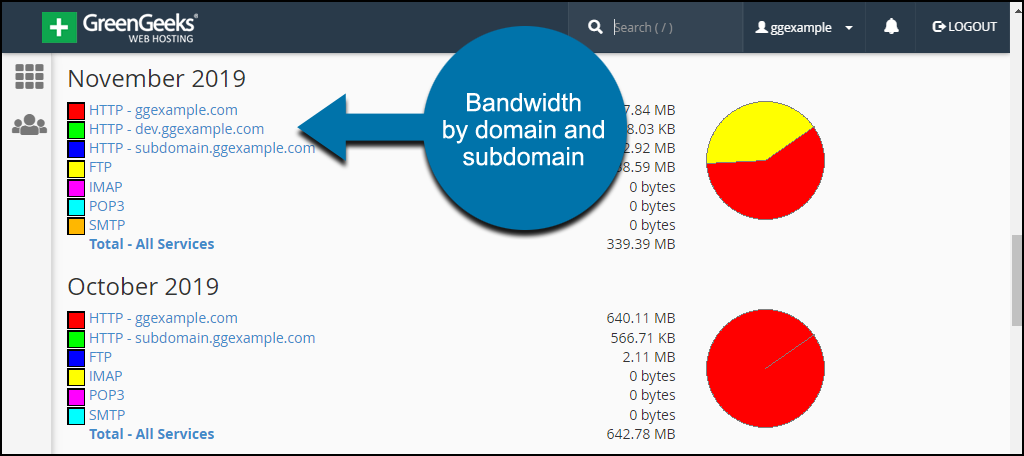
Each of the services links to daily bandwidth use details.
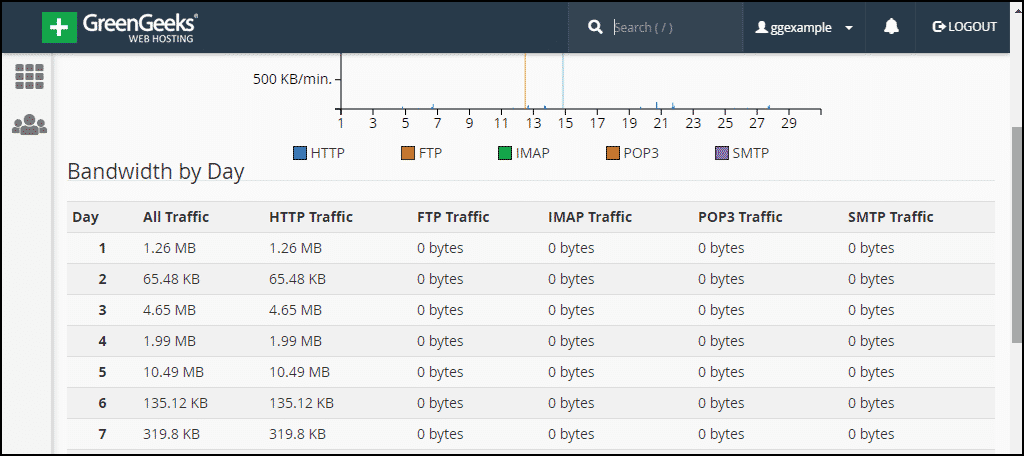
Clicking the “Total – All Services” link or the pie chart takes you to a daily bandwidth use table. This will show usage for all services on one page.
What Do Bandwidth Usage Statistics Tell Us?
In the everyday course of running a website, you won’t always know when traffic increases or decreases. Your site, or a page on your site, could be linked from a popular website temporarily increasing your bandwidth usage (sometimes dramatically).
If you receive an alert for excessive bandwidth use but you’re not sure why, you can check the stats to see if a certain day or period of time showed excessive traffic. That can give you clues to where the usage came from.
Similarly, you can use the statistics to see if a promotional effort was successful since you know the date or time that your promotion was active.
If your site falls victim to an attack of some kind, the bandwidth statistics can show you the time and duration of the attack.
What the Bandwidth Statistics in cPanel Do Not Show
- cPanel file manager uploads and downloads
- Incoming mail that non-GreenGreeks servers deliver
- POP/IMAP tasks such as checking for new email
- DNS activity
- Processes spawned by cron jobs that perform network activity
It’s important to note that because the cPanel bandwidth statistics do not include all of the bandwidth used by your account, they may differ from bandwidth usage numbers provided to you by GreenGeeks technical support staff.